Pricing 100,000 seats
85% of Camp Nou's ~100,000 seats are owned by socis – FC Barcelona's club members. If a member can't attend a match, they can release their seat back to the club for resale. The problem: on average, 40% of those seats are released in the last 72 hours before the match. But fan demand is already high weeks or months before.

Members release seats back to the club through the Members App.
So you're trying to price and sell something you don't have yet. The seats will come but you don't know exactly when. That gap between late supply and early demand was the problem we worked on, and it was costing the club real revenue.
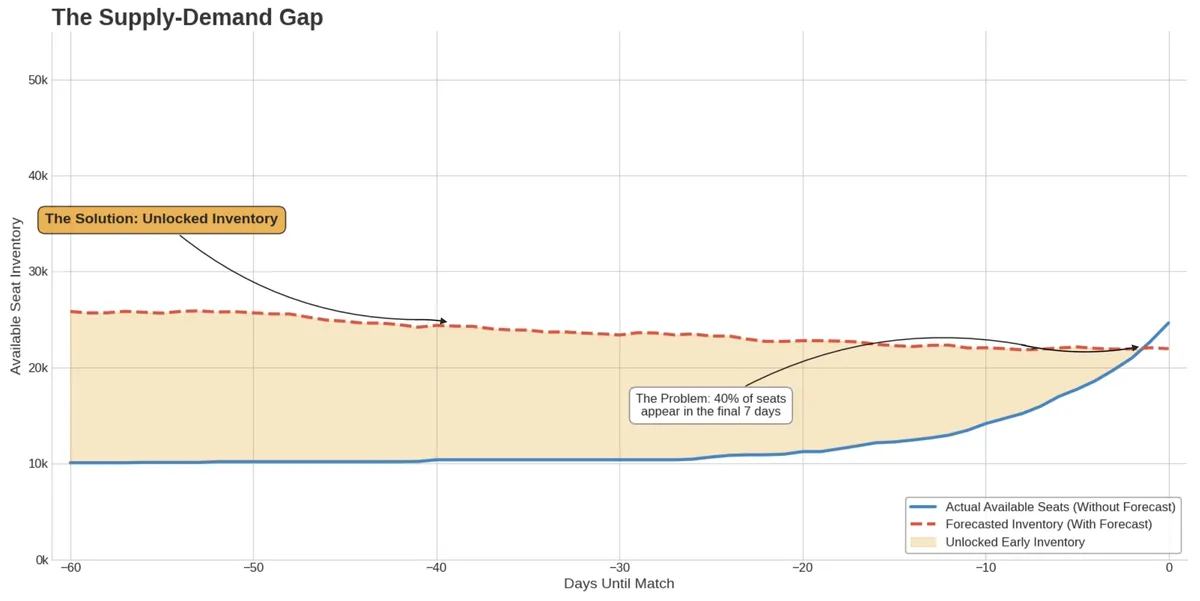
The supply-demand gap between early fan demand and late seat releases.
The solution was two ML systems that work together: one to forecast supply, one to forecast demand and set prices. Neither is useful on its own. A pricing model without reliable inventory forecasts is just guessing. A supply forecast without a pricing strategy doesn't do much with the opportunity.
Modeling supply
The first question: how many seats will members release for a given match and zone?
This is not a one-time prediction. It's a rolling forecast that updates every day as new release data comes in.
The model was an XGBoost regressor trained on time-series data – daily snapshots per match and zone. Features included match context (opponent quality, competition, day of the week), team form (league position, recent results, key injuries), external factors (holidays, weather, other events in the city), and one important dynamic feature: the number of seats released so far. The target was the final count of released seats.
The model produced forecasts at seven time horizons – 1, 3, 7, 14, 30, and 90 days before the match – so the ticketing manager could see the prediction improve as the match got closer. This was not an automated system. The ticketing manager(s) reviewed each forecast, applied a safety margin based on their experience, and decided how many seats to make available for sale. The model gave them a number; they made the decision.
Before this, there was no forecasting system. Baseline:
| Source | Accuracy (R²) |
|---|---|
| Statistical averages | 45% |
| Domain experts | 65% |
| ML model | 84% |
Interpretability was just as important as accuracy. We used SHAP values to check that the model was learning real patterns. Opponent quality, days until the match, and seats released so far were the most important features – which matched what the ticketing team already knew. That alignment helped build trust.
We validated the business impact using Propensity Score Matching. We paired recent matches (where the system was active) with similar historical matches (where it wasn't), controlling for opponent, competition, timing, and other variables. The result: a 15% increase in total ticket sales revenue, directly linked to the forecasting system.
Modeling demand
With supply forecasted, the next question: at a given price, how many tickets will we sell?
The demand model combined Prophet and XGBoost in a two-step approach. Prophet modeled the base time-series patterns – trend, seasonality, and match-day effects. XGBoost then modeled what Prophet missed, using a wider set of features: opponent strength, social media sentiment, web traffic, Google Trends, secondary market prices, and tourism signals like flight booking volumes to Barcelona.
The idea was simple: Prophet learns the rhythm of the season. XGBoost learns why a Tuesday match against a mid-table team with rain in the forecast sells differently than the same fixture on a sunny Saturday.
We tested several model architectures. The combined model had the lowest WAPE (Weighted Absolute Percentage Error), which was our main metric – it told us directly how far off your revenue forecast was, which is also what the commercial team cares about.
This model also powered an impact simulation tool. The commercial team could enter a price and immediately see the expected effect on revenue and sales. No more manual analysis in spreadsheets.
Closing the loop
The two models fed into an optimization layer. The goal: find the set of prices that maximizes total match-day profit across all zones, within business constraints.
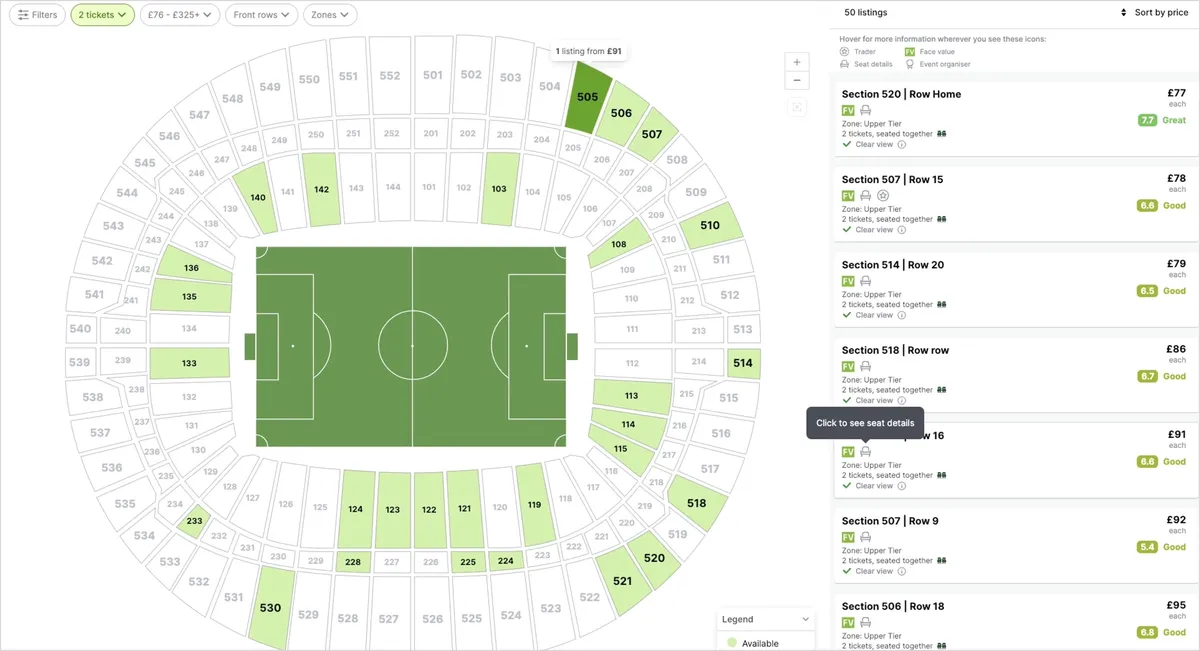
Standard stadium ticket pricing by zone.
The objective function included ticket revenue (price × predicted sales per zone), estimated in-stadium spending per person, and operational costs. The constraints: you can't sell more seats than you have, and the main TV-visible zone must stay above 85% occupancy to protect how the stadium looks (and comply with broadcasting rights) and to protect the brand.
In practice, this was a grid search over valid prices. For each price, the demand model predicted sales, and the engine selected the price that maximized revenue. With well-defined constraints, a full search guaranteed we found the best option.
What made this useful was the pricing decision framework – a matrix that mapped supply and demand into four states, each with a different strategy:
| Low Supply | High Supply | |
|---|---|---|
| High Demand | Maximize margin | Keep a strong price |
| Low Demand | Hold or reduce slightly | Reduce price, run promotions |
The engine ran in revenue maximization mode by default. But when the sell-through pace – actual sales divided by expected sales at that point – dropped below 1.0, it switched to velocity acceleration: finding the lowest price needed to recover the target occupancy.
This was the most important design choice. Instead of trying to optimize for multiple goals at once, we made occupancy a hard rule and revenue the goal. Then we let the policy switch handle the balance. Easier to build, easier to explain, and it worked.
What connected the two
The two systems were not separate projects. The supply forecast was a direct input to the pricing model – you can't set the right price without knowing how many seats you'll have.
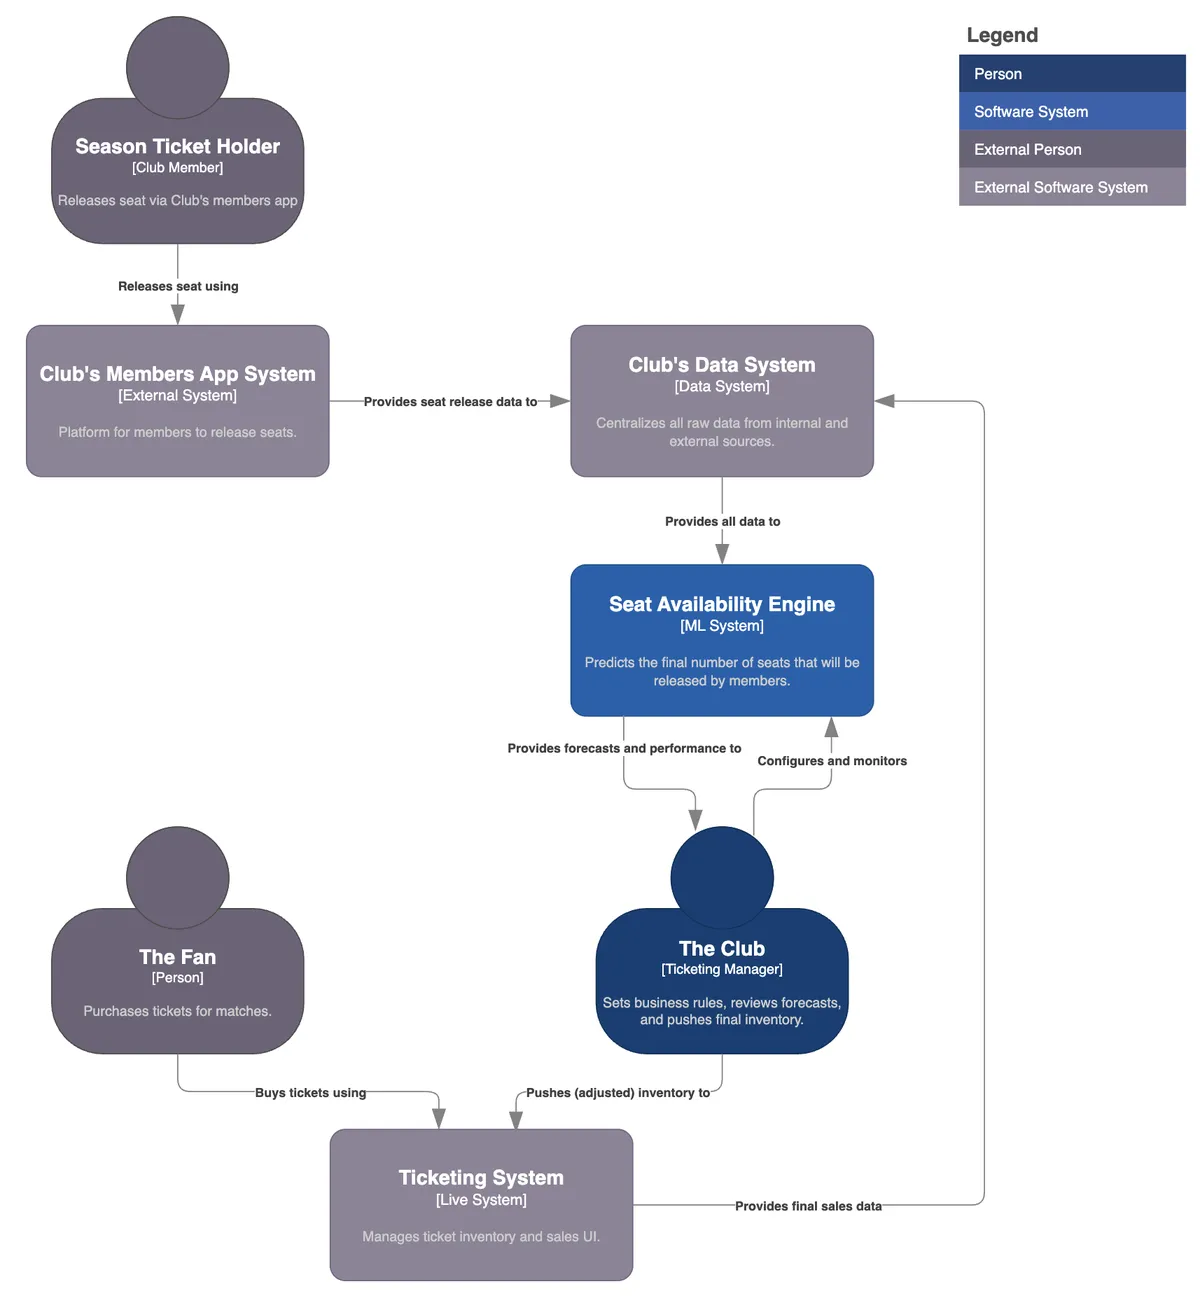
System Context Diagram: Seat Availability Engine.
And the pricing model's demand predictions helped the ticketing manager(s) decide how aggressively to release forecasted inventory.
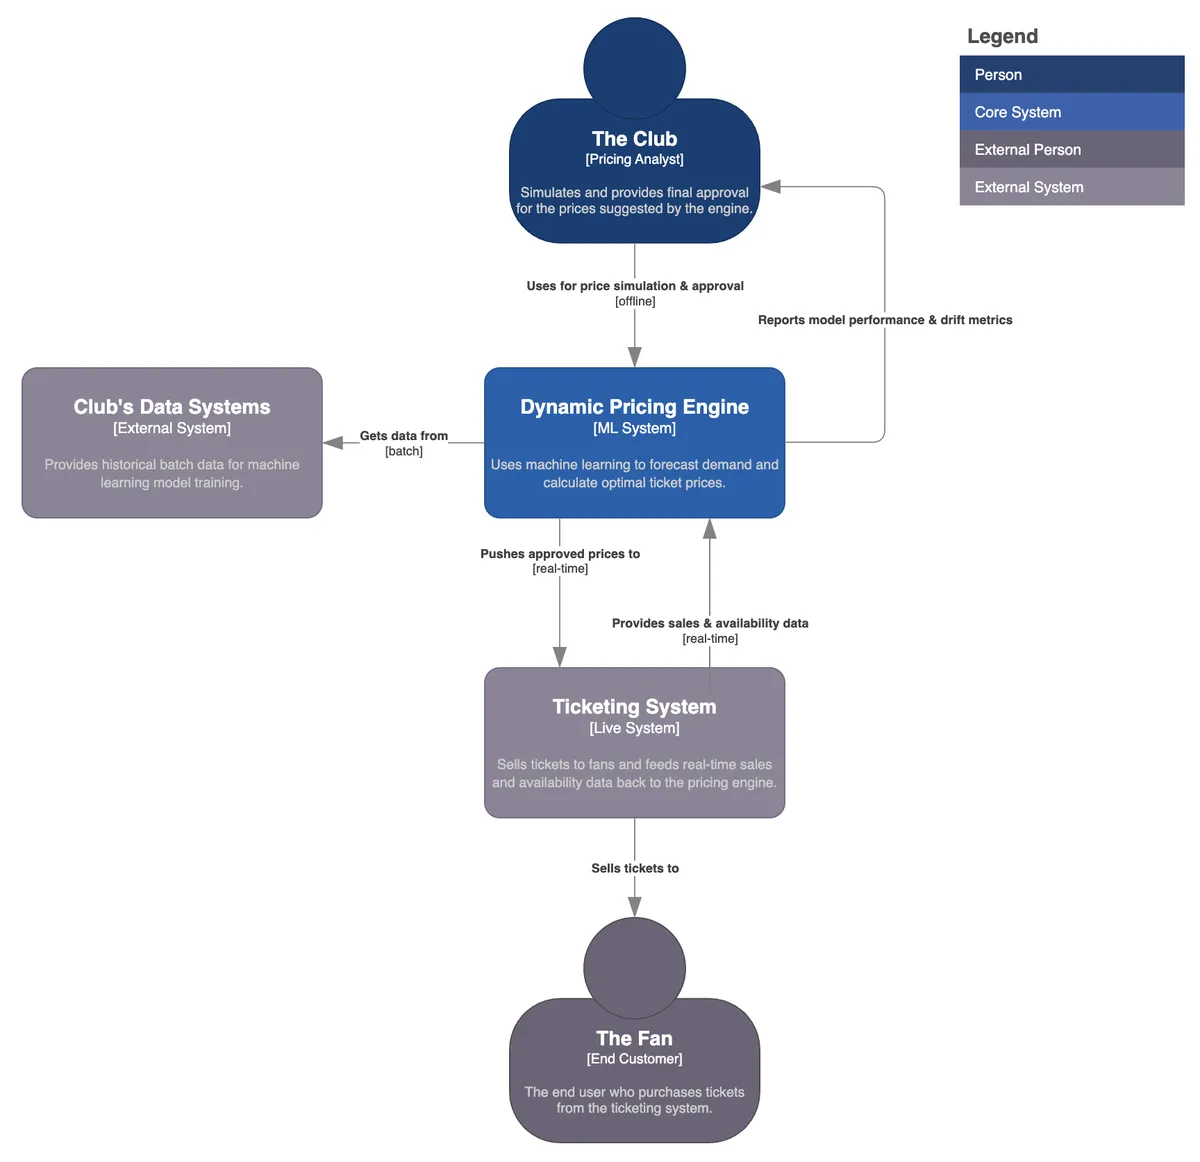
System Context Diagram: Dynamic Pricing System.
That cycle – forecast supply, price against it, monitor sales, adjust – moved the team from a slow, weekly process to a daily one. The commercial team stopped spending time collecting and preparing data. They started spending it on decisions: which matches to promote, when to launch campaigns, how much safety margin to keep.
The system produced a Price Variation Proposal – a recommendation sent to the commercial team. If approved with one click, the new prices went live on the ticketing platform through the API. A human always reviewed it, but with no unnecessary steps.
This was a market with almost no competition – there is no real substitute for being at Camp Nou on match day. That gave us strong pricing power, but also a responsibility to price fairly and keep the stadium full. The goal was never to extract the maximum price from every seat. It was to make better decisions, faster, using data instead of intuition.
Disclaimer: The views and opinions expressed in this publication are those of the author and do not necessarily reflect the views or positions of any entities he represents.
Built by with AI.